Using Jamovi: Logistic Regression
29 Mar 2018This post is part of a series–demonstrating the use of Jamovi–mainly because some of my students asked for it. Notably, this is using version 0.8.6.0. Today’s topic is logistic regression (with a binary outcome).
Note: This starts by assuming you know how to get data into Jamovi and start getting descriptive statistics.
Logistic Regression
Running correlation in Jamovi requires only a few steps once the data is ready to go. To start, click on the Regression tab and then on 2 Outcomes below the “Logistic Regression” minor header. The following screen becomes visible.
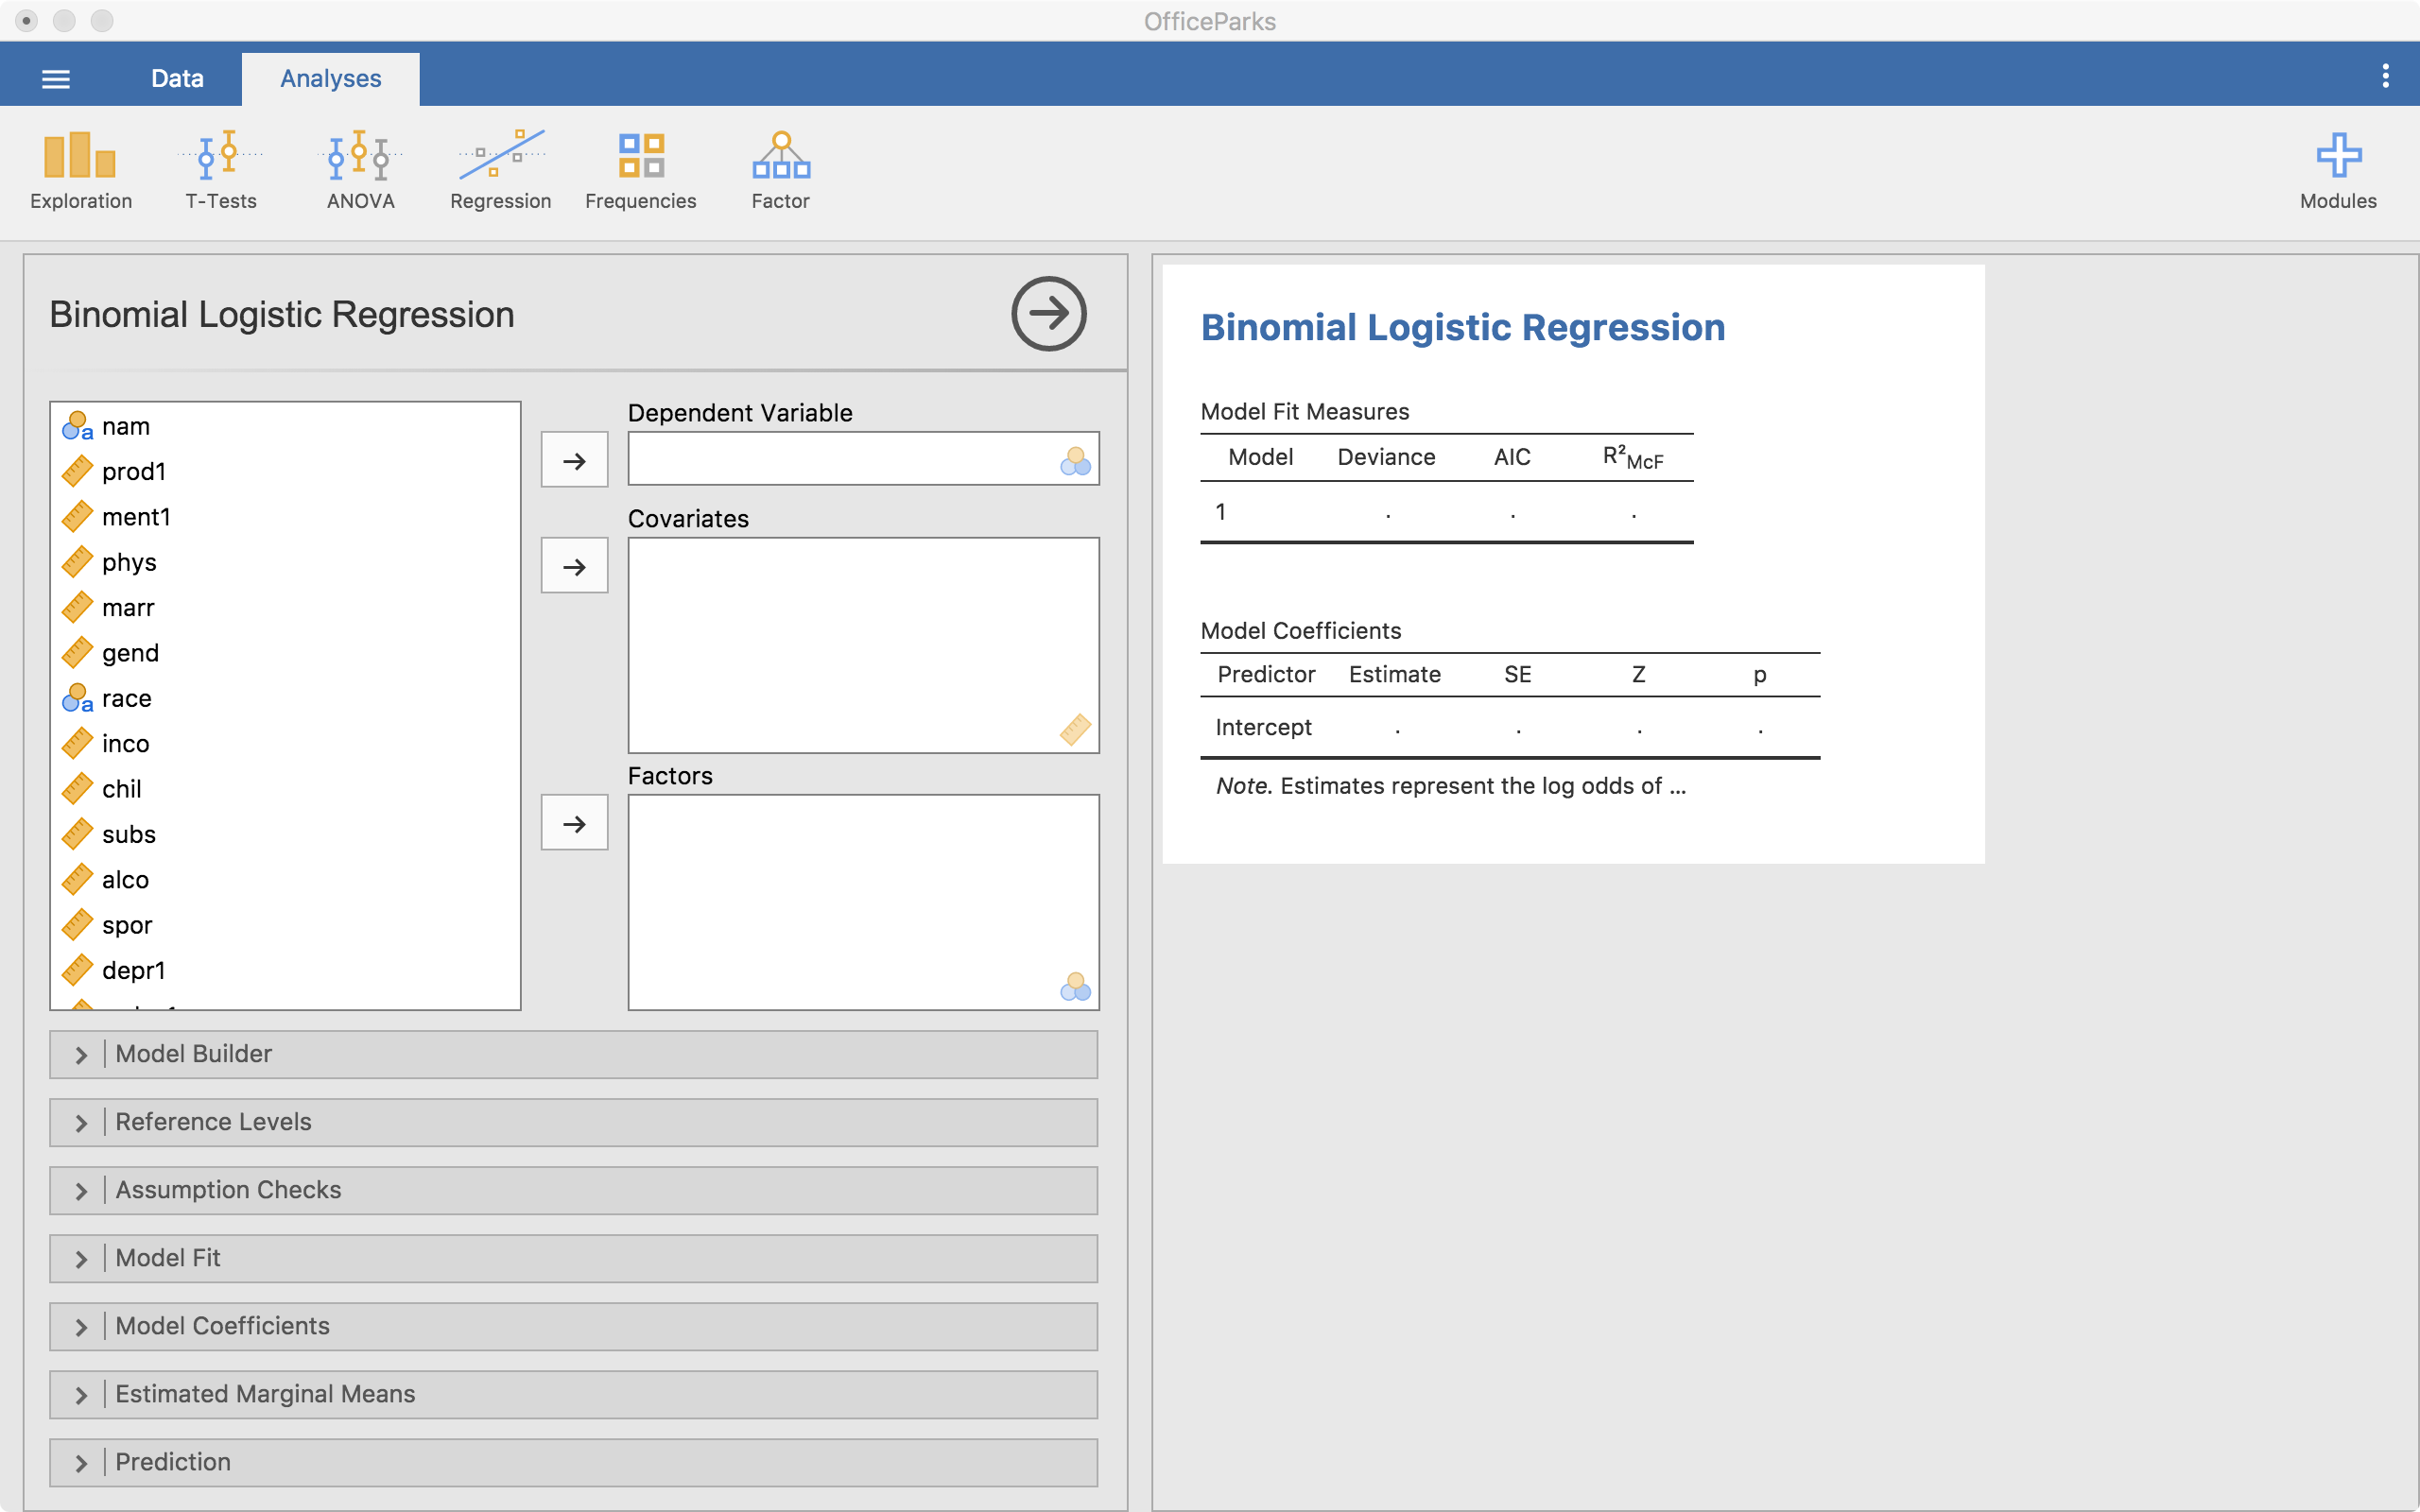
In this instance, we need to have a binary outcome that we put into the “Dependent Variable” slot. As was the case in the Linear Regression method in Jamovi, the covariates are the continuous predictors and the factors are the categorical predictors. Here, we have a continuous predictor and a categorical predictor.
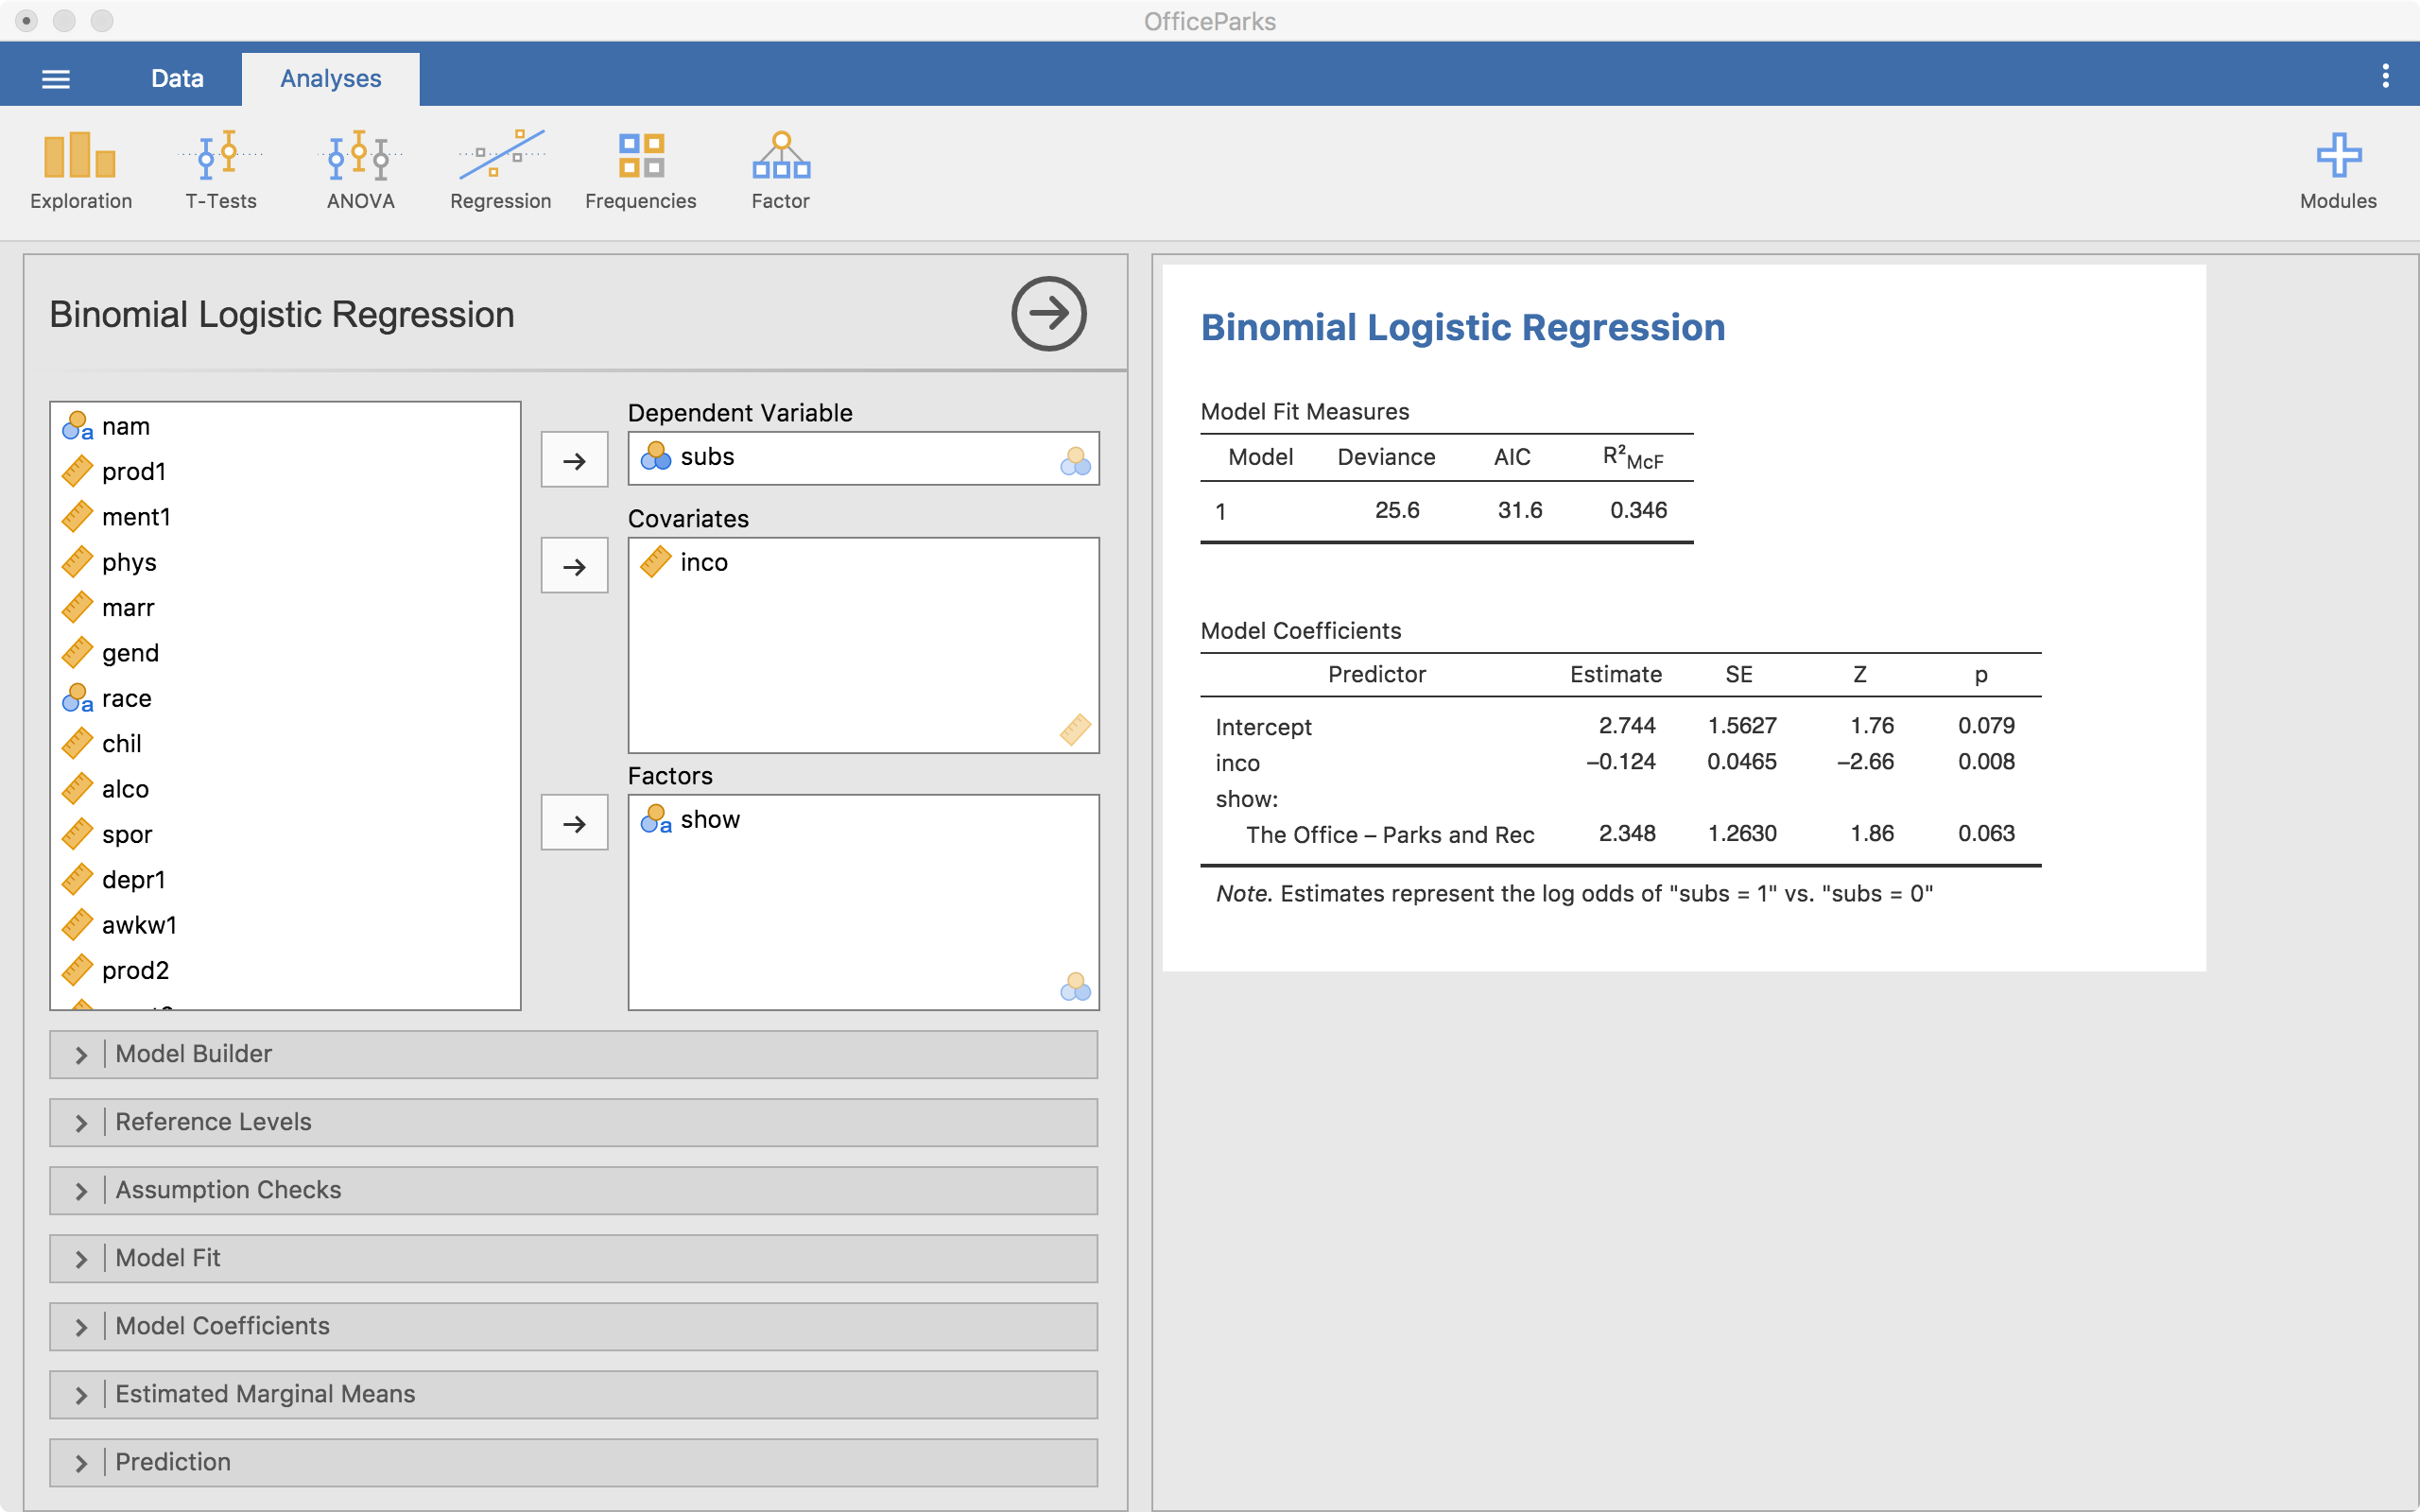
Notice that the tables start autofilling once you place the variables in those slots.
Model Specifications
The next thing we need to consider is how the model will look and how we will built up the models. There’s no “proven” way to do this but there are some common practices. To build the model, we will use the + Add New Block button. “Blocks” are individual building blocks of the final model. In each block we will add a variable(s). Each block is then compared statistically so we can decide if one model is significantly better than the others.
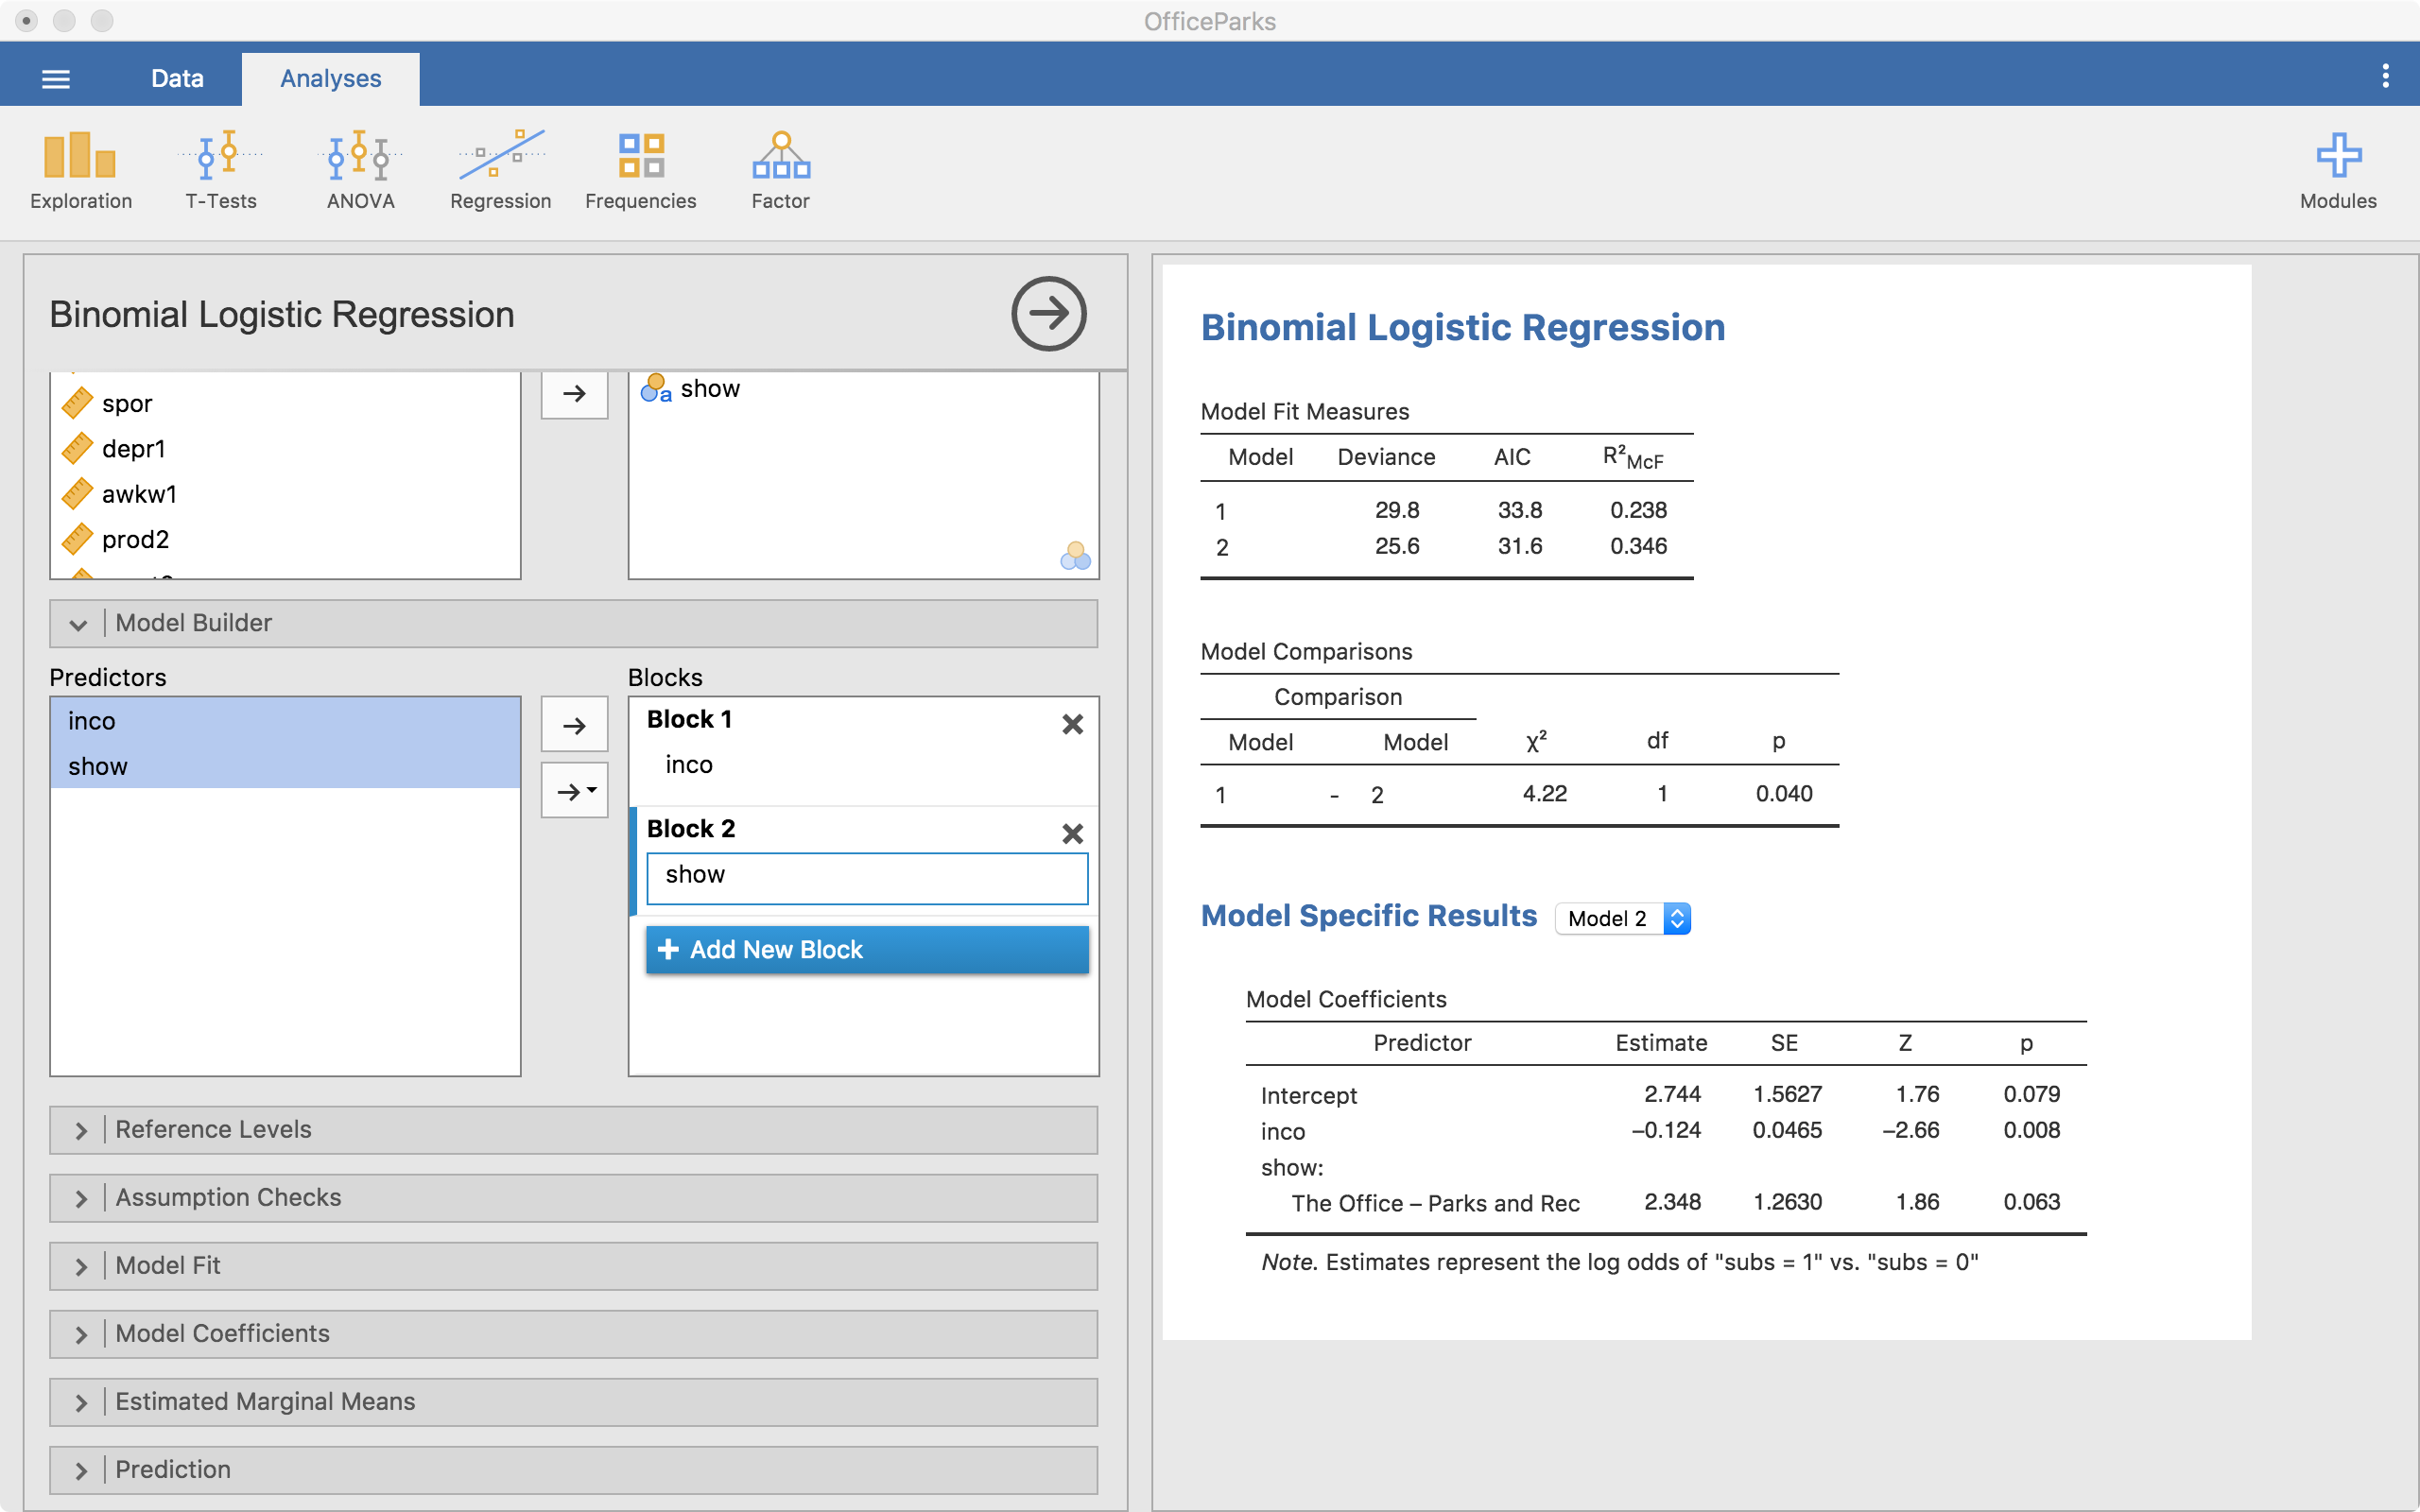
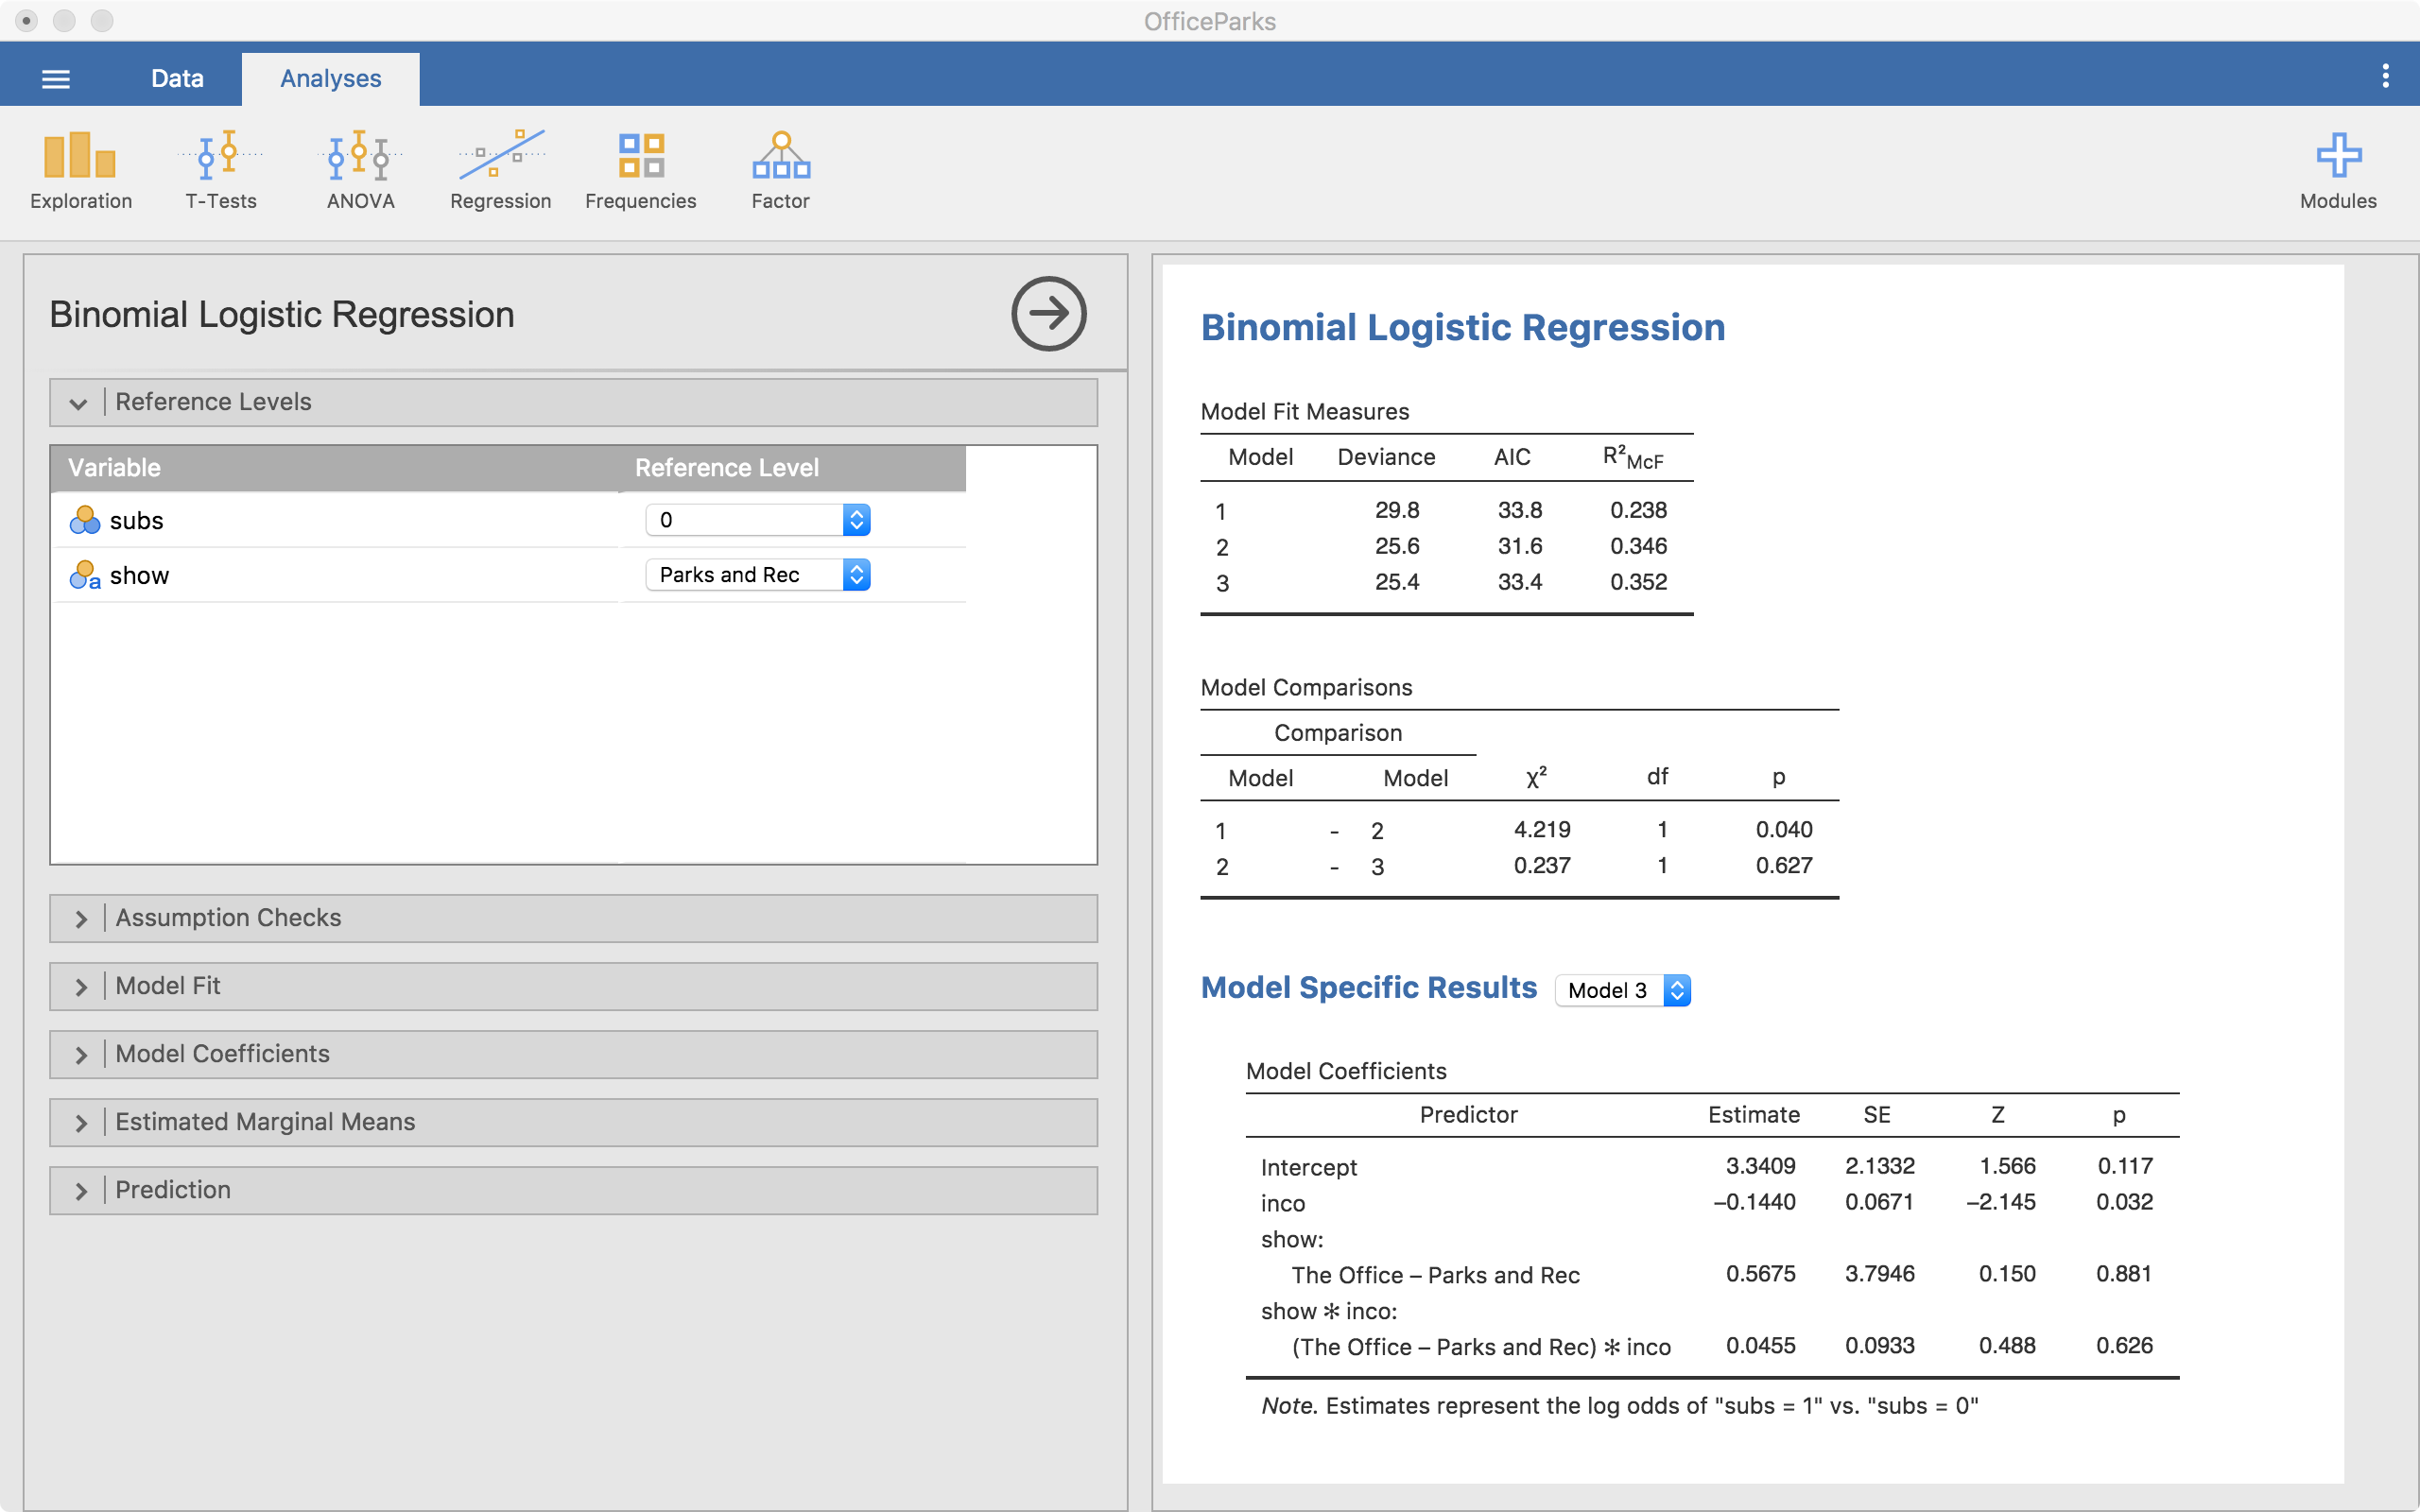
In the example above, we start with just inco (income) in the model (Block 1). Then we add another block and add show (Block 2). Notice that in the output we have a few things showing up.
- We have model fit statistics for each model.
- We have a “Model Comparisons” table showing us that from model 1 to 2, we are significantly different (p = .040).
- Then we have “Model Specific Results” with a drop-down menu to select one of the models (right now it is on Model 2).
From here, we can also look at an interaction between Pretest and Group. To do that we add a new block, highlight both pretest and group from the left-hand side list, select the arrow that has a downward triangle and select “Interaction”. When we do that, the new block has Group*Pretest now added to it, which means we did it right.
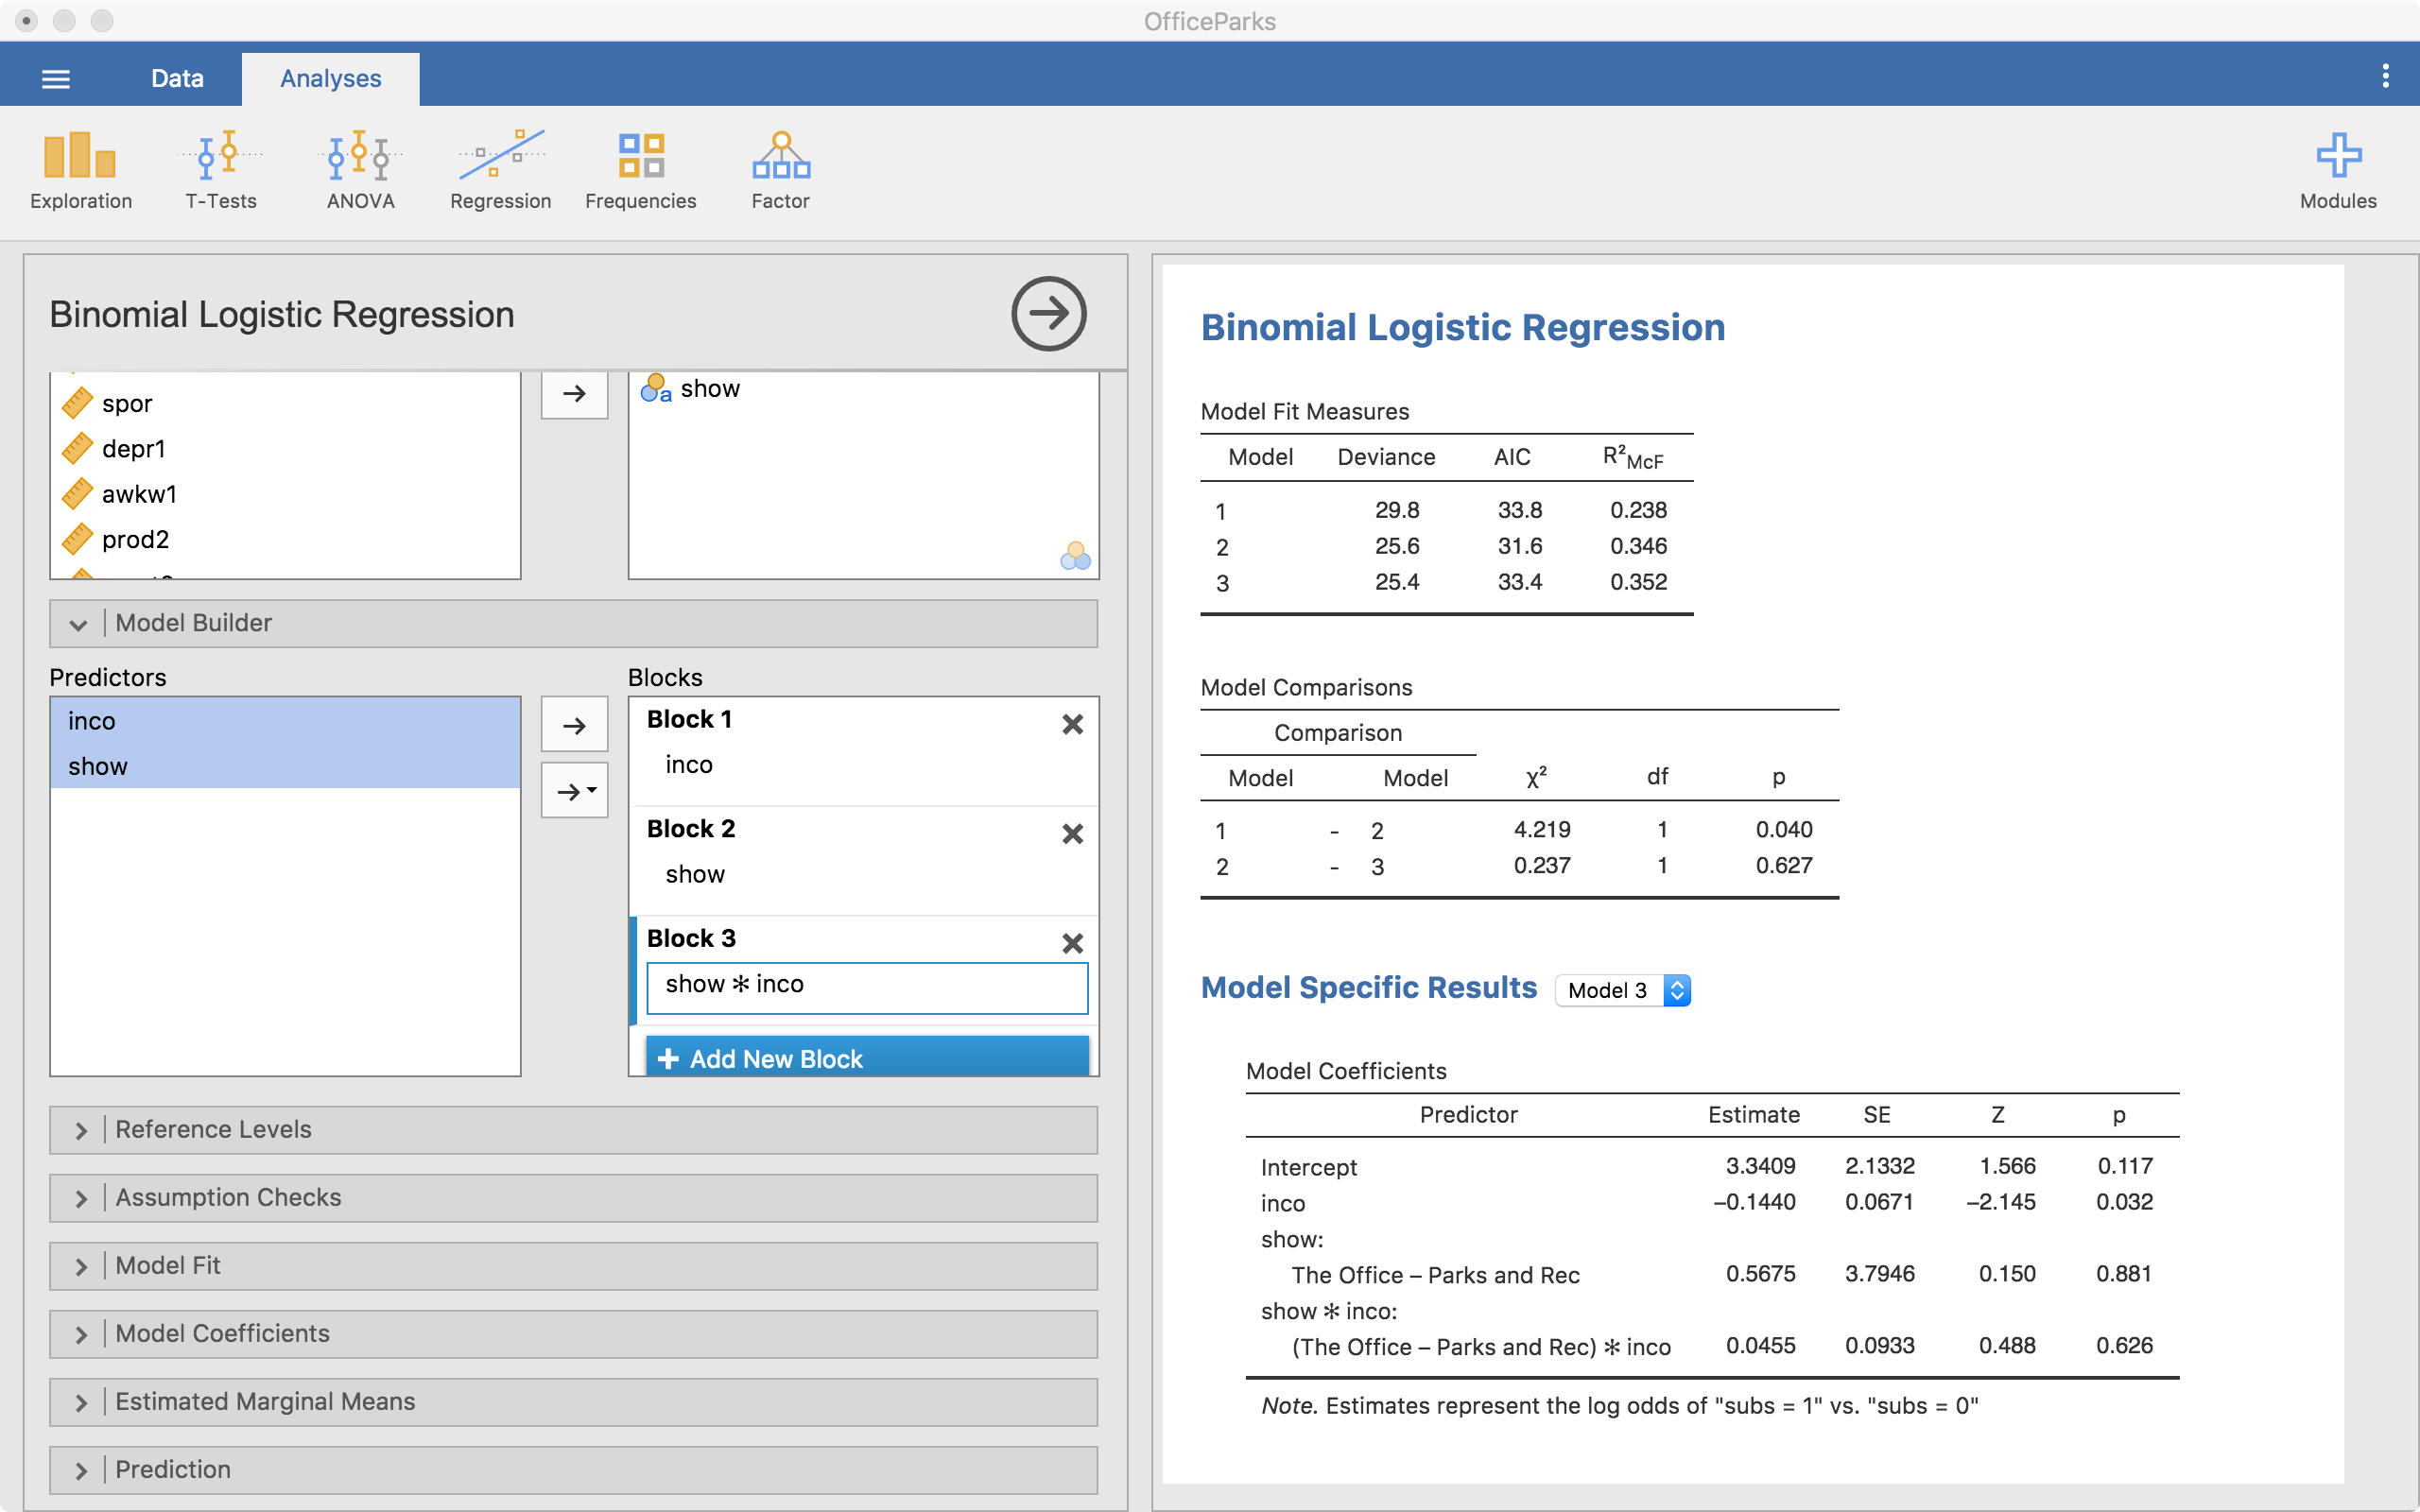
In this case, we can see that the model with the interaction isn’t statistically better than the model without it (p = .627). At this point, we have our model built up very well but now we can make small adjustments with the following menus.
Reference Levels
This menu allows us to change the reference level of any categorical variables. This includes our outcome variable, since it is also a categorical variable. We can change either reference category. For the outcome, that changes what we are predicting; when the reference category is 0, we are predicting the probability of being 1 in the outcome. If we switch it, we would be predicting being 0.
Notice that in the coefficients table, it says The Office - Parks and Rec under Show:. This says that (and the screenshot agrees), level “Parks and Rec” is the reference level. This means, our comparisons for the show variable is in reference to “Parks and Rec”. So any differences reported are based on a comparison with “Parks and Rec”. We can change this if we need to in order to understand the model better.
Assumption Checks
Jamovi provides only one assumption check–that for collinearity. I won’t cover the meaning of that here, but know that it is possible to check that. Other assumptions are much more difficult to test in general, and are therefore not (yet?) integrated into Jamovi.
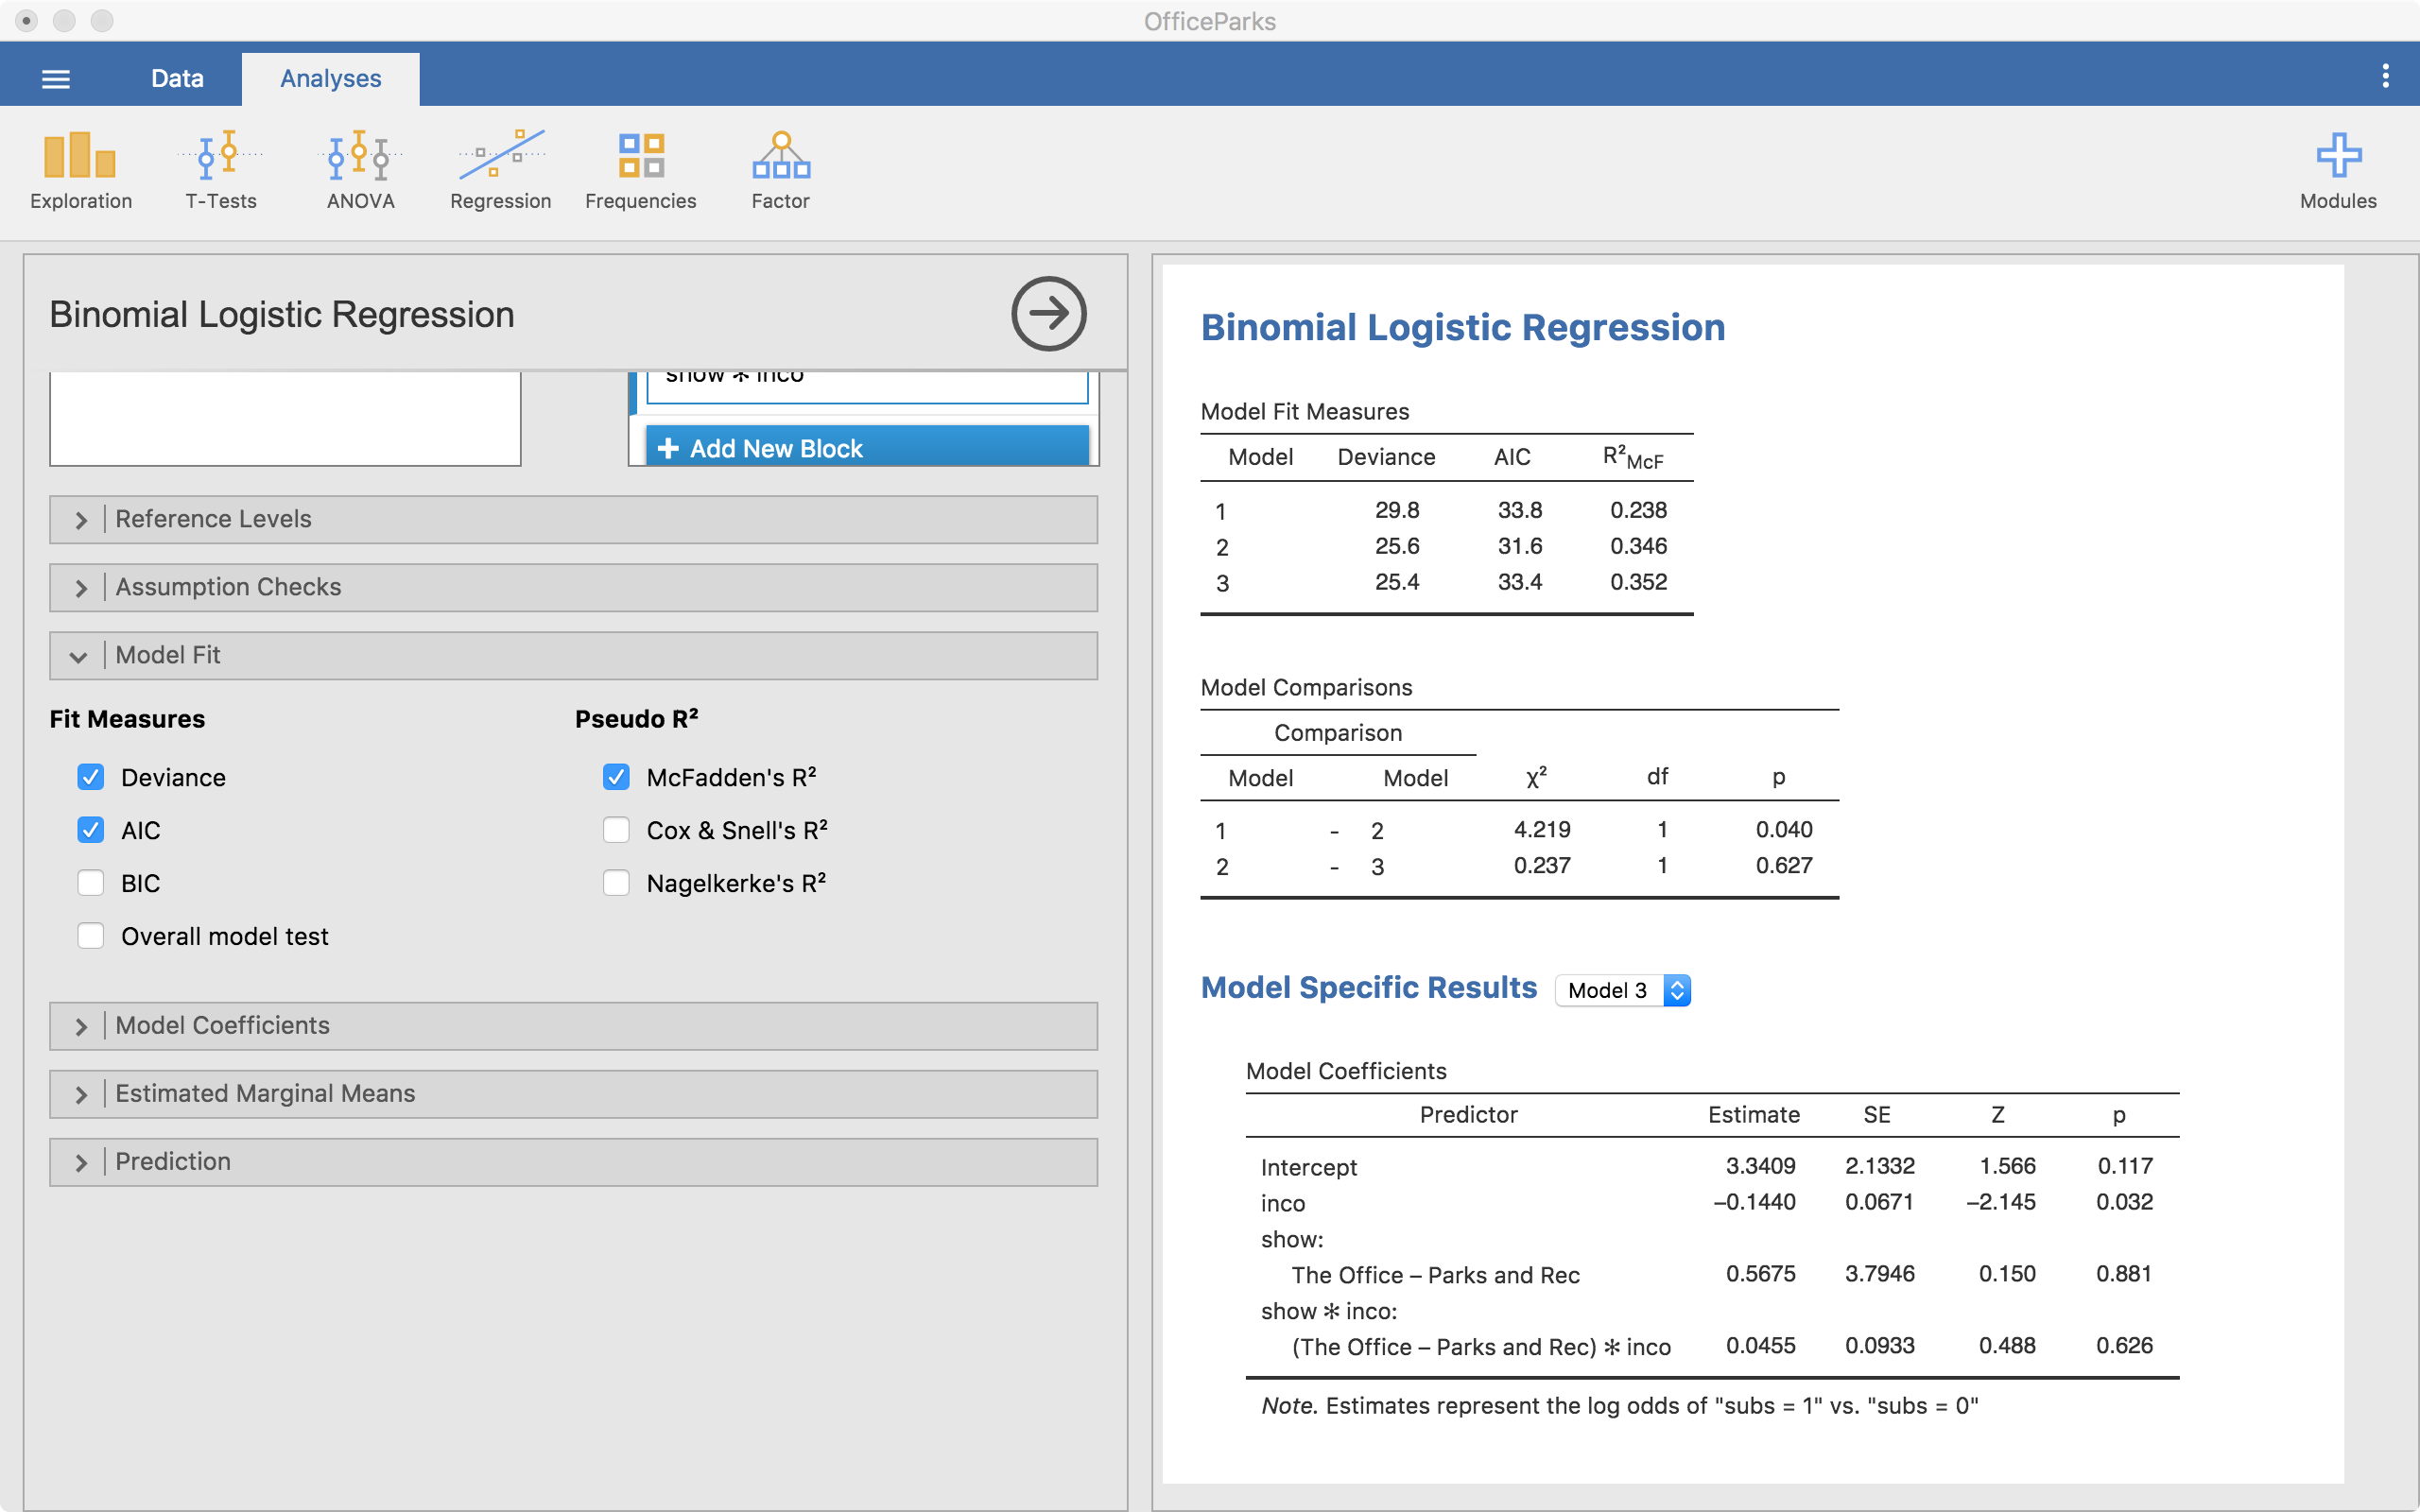
Model Fit
The model fit menu gives us the options to get a number of model fit statistics. For our purposes, the default works just fine.
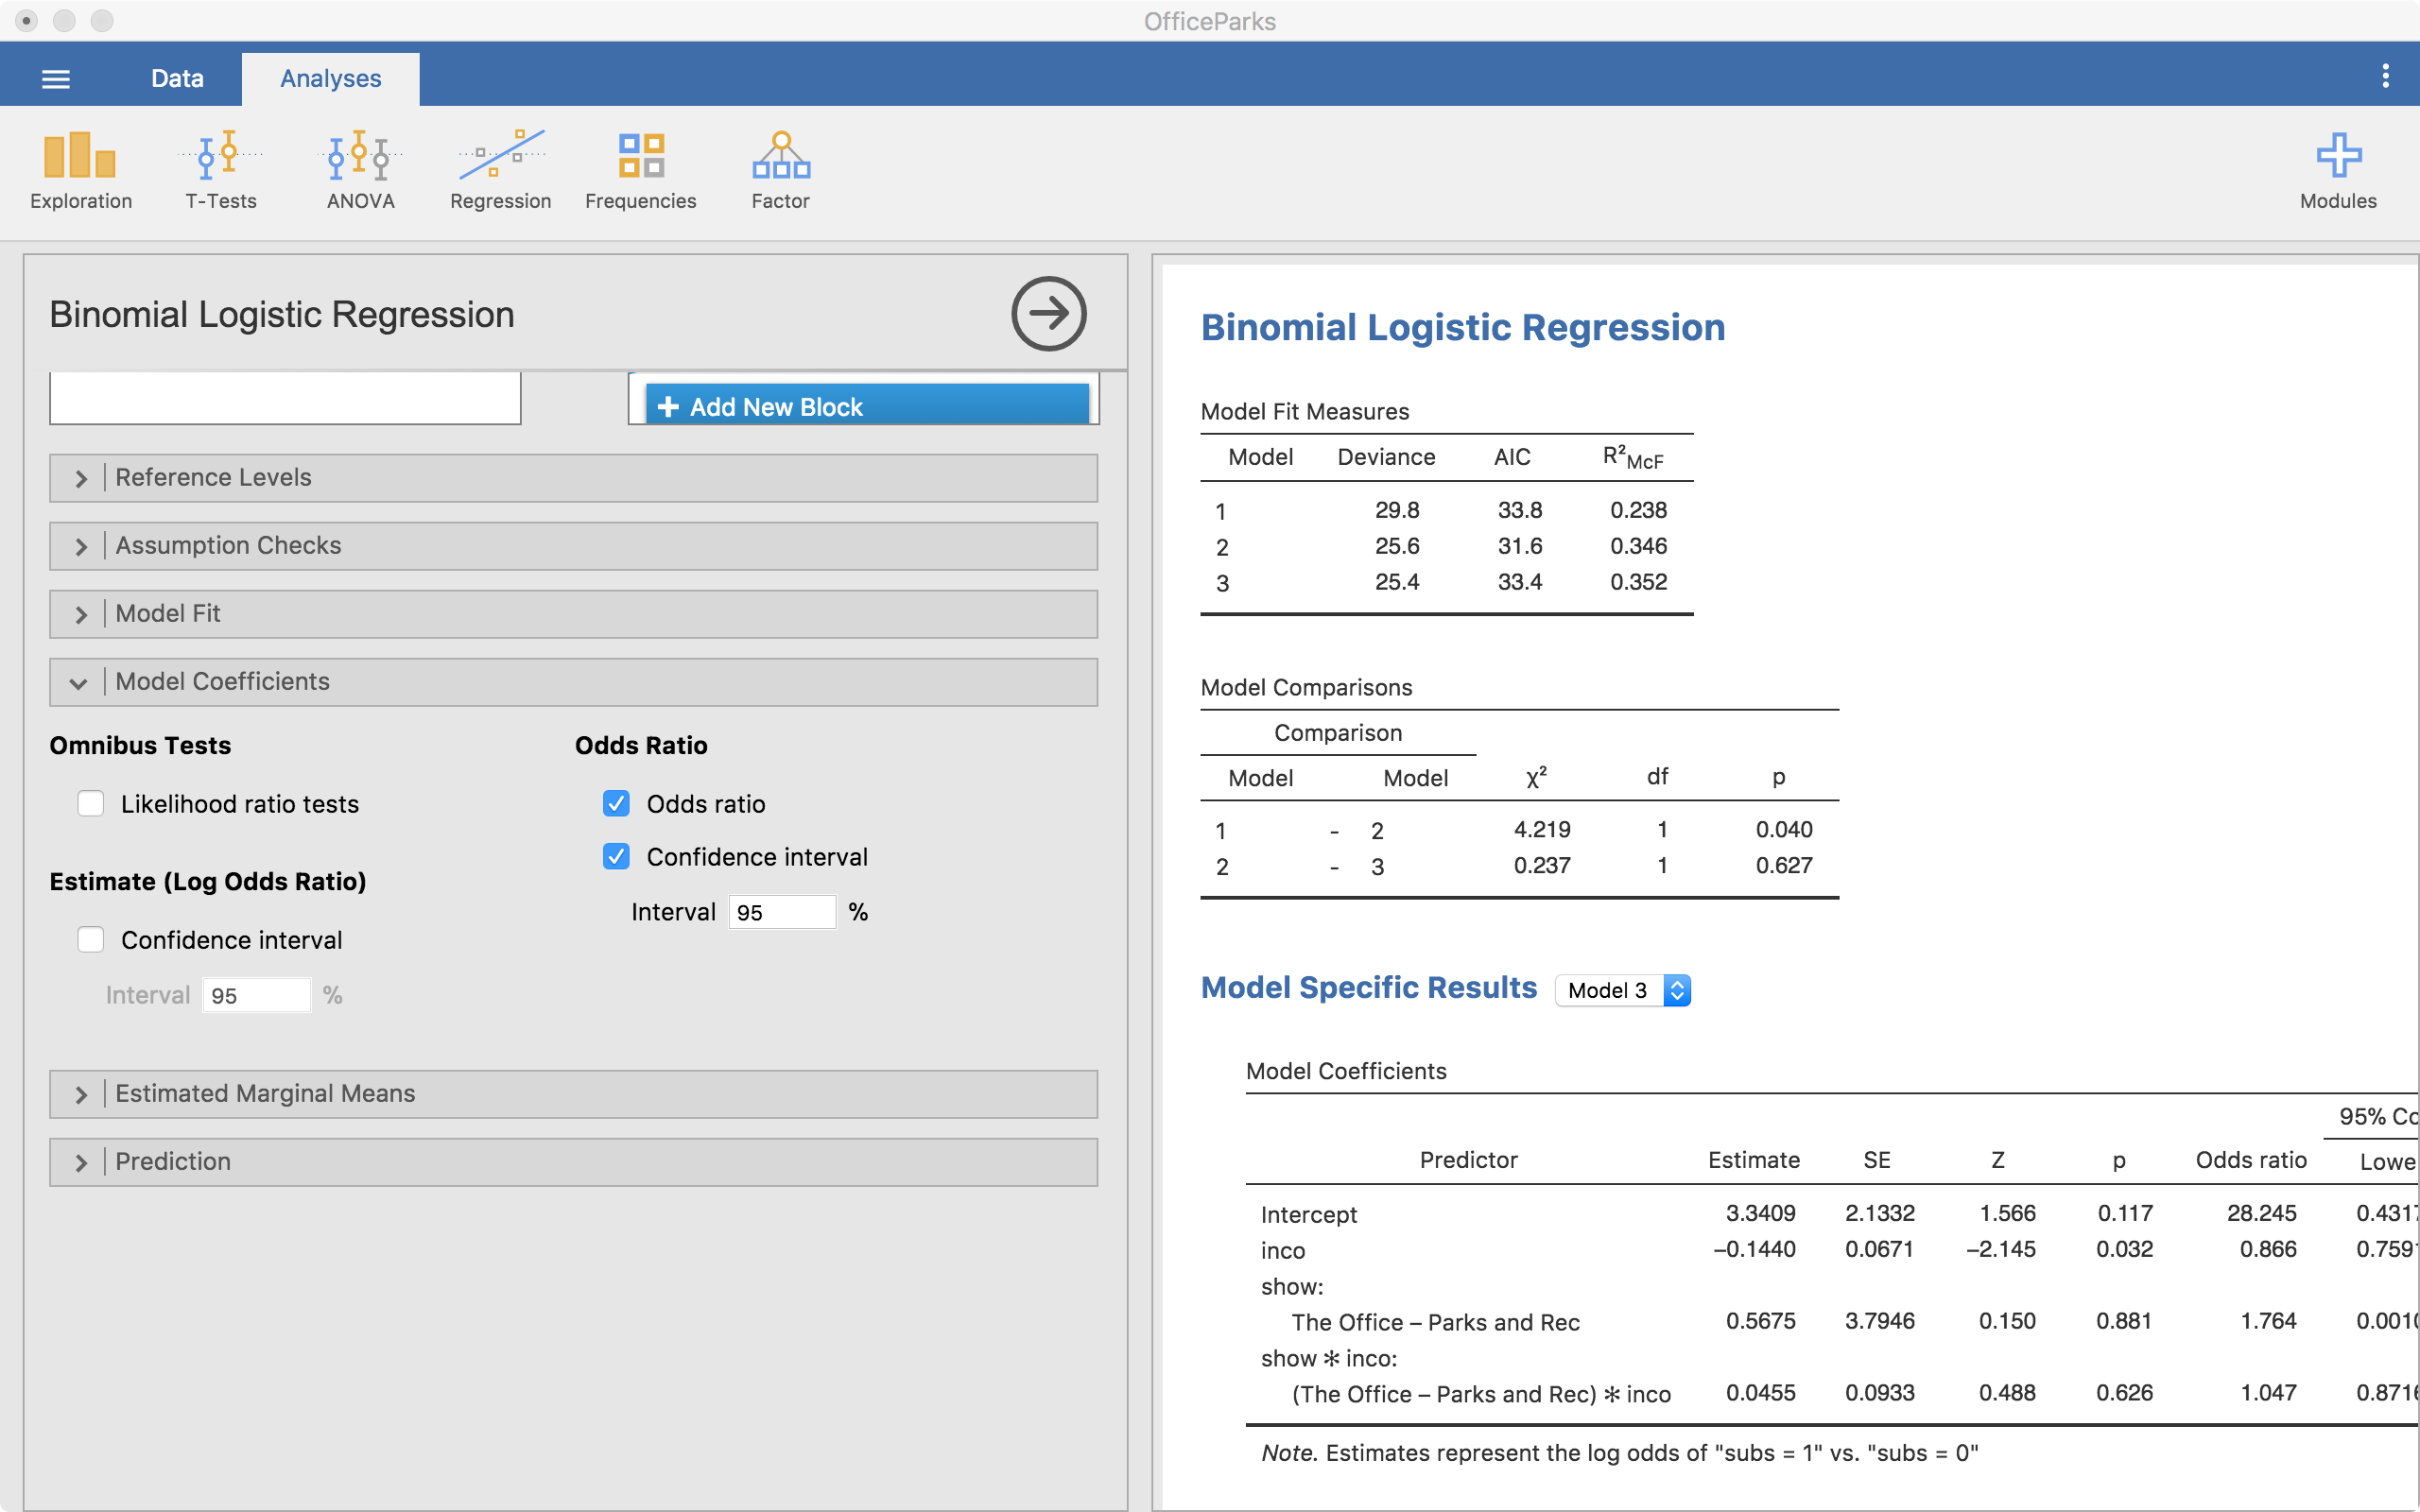
Model Coefficients
We can also ask for a bit more information regarding our model estimates. The most important thing to ask for here are the odds ratios and the confidence intervals of the odds ratios.
Estimated Marginal Means
Finally and importantly, we can look at the estimated marginal means. This will provide plots that can help understand coefficients better, particularly interactions. In logistic regression, we are going to be assessing the predicted probabilities across variables. Here, we see the predicted probabilities across income.
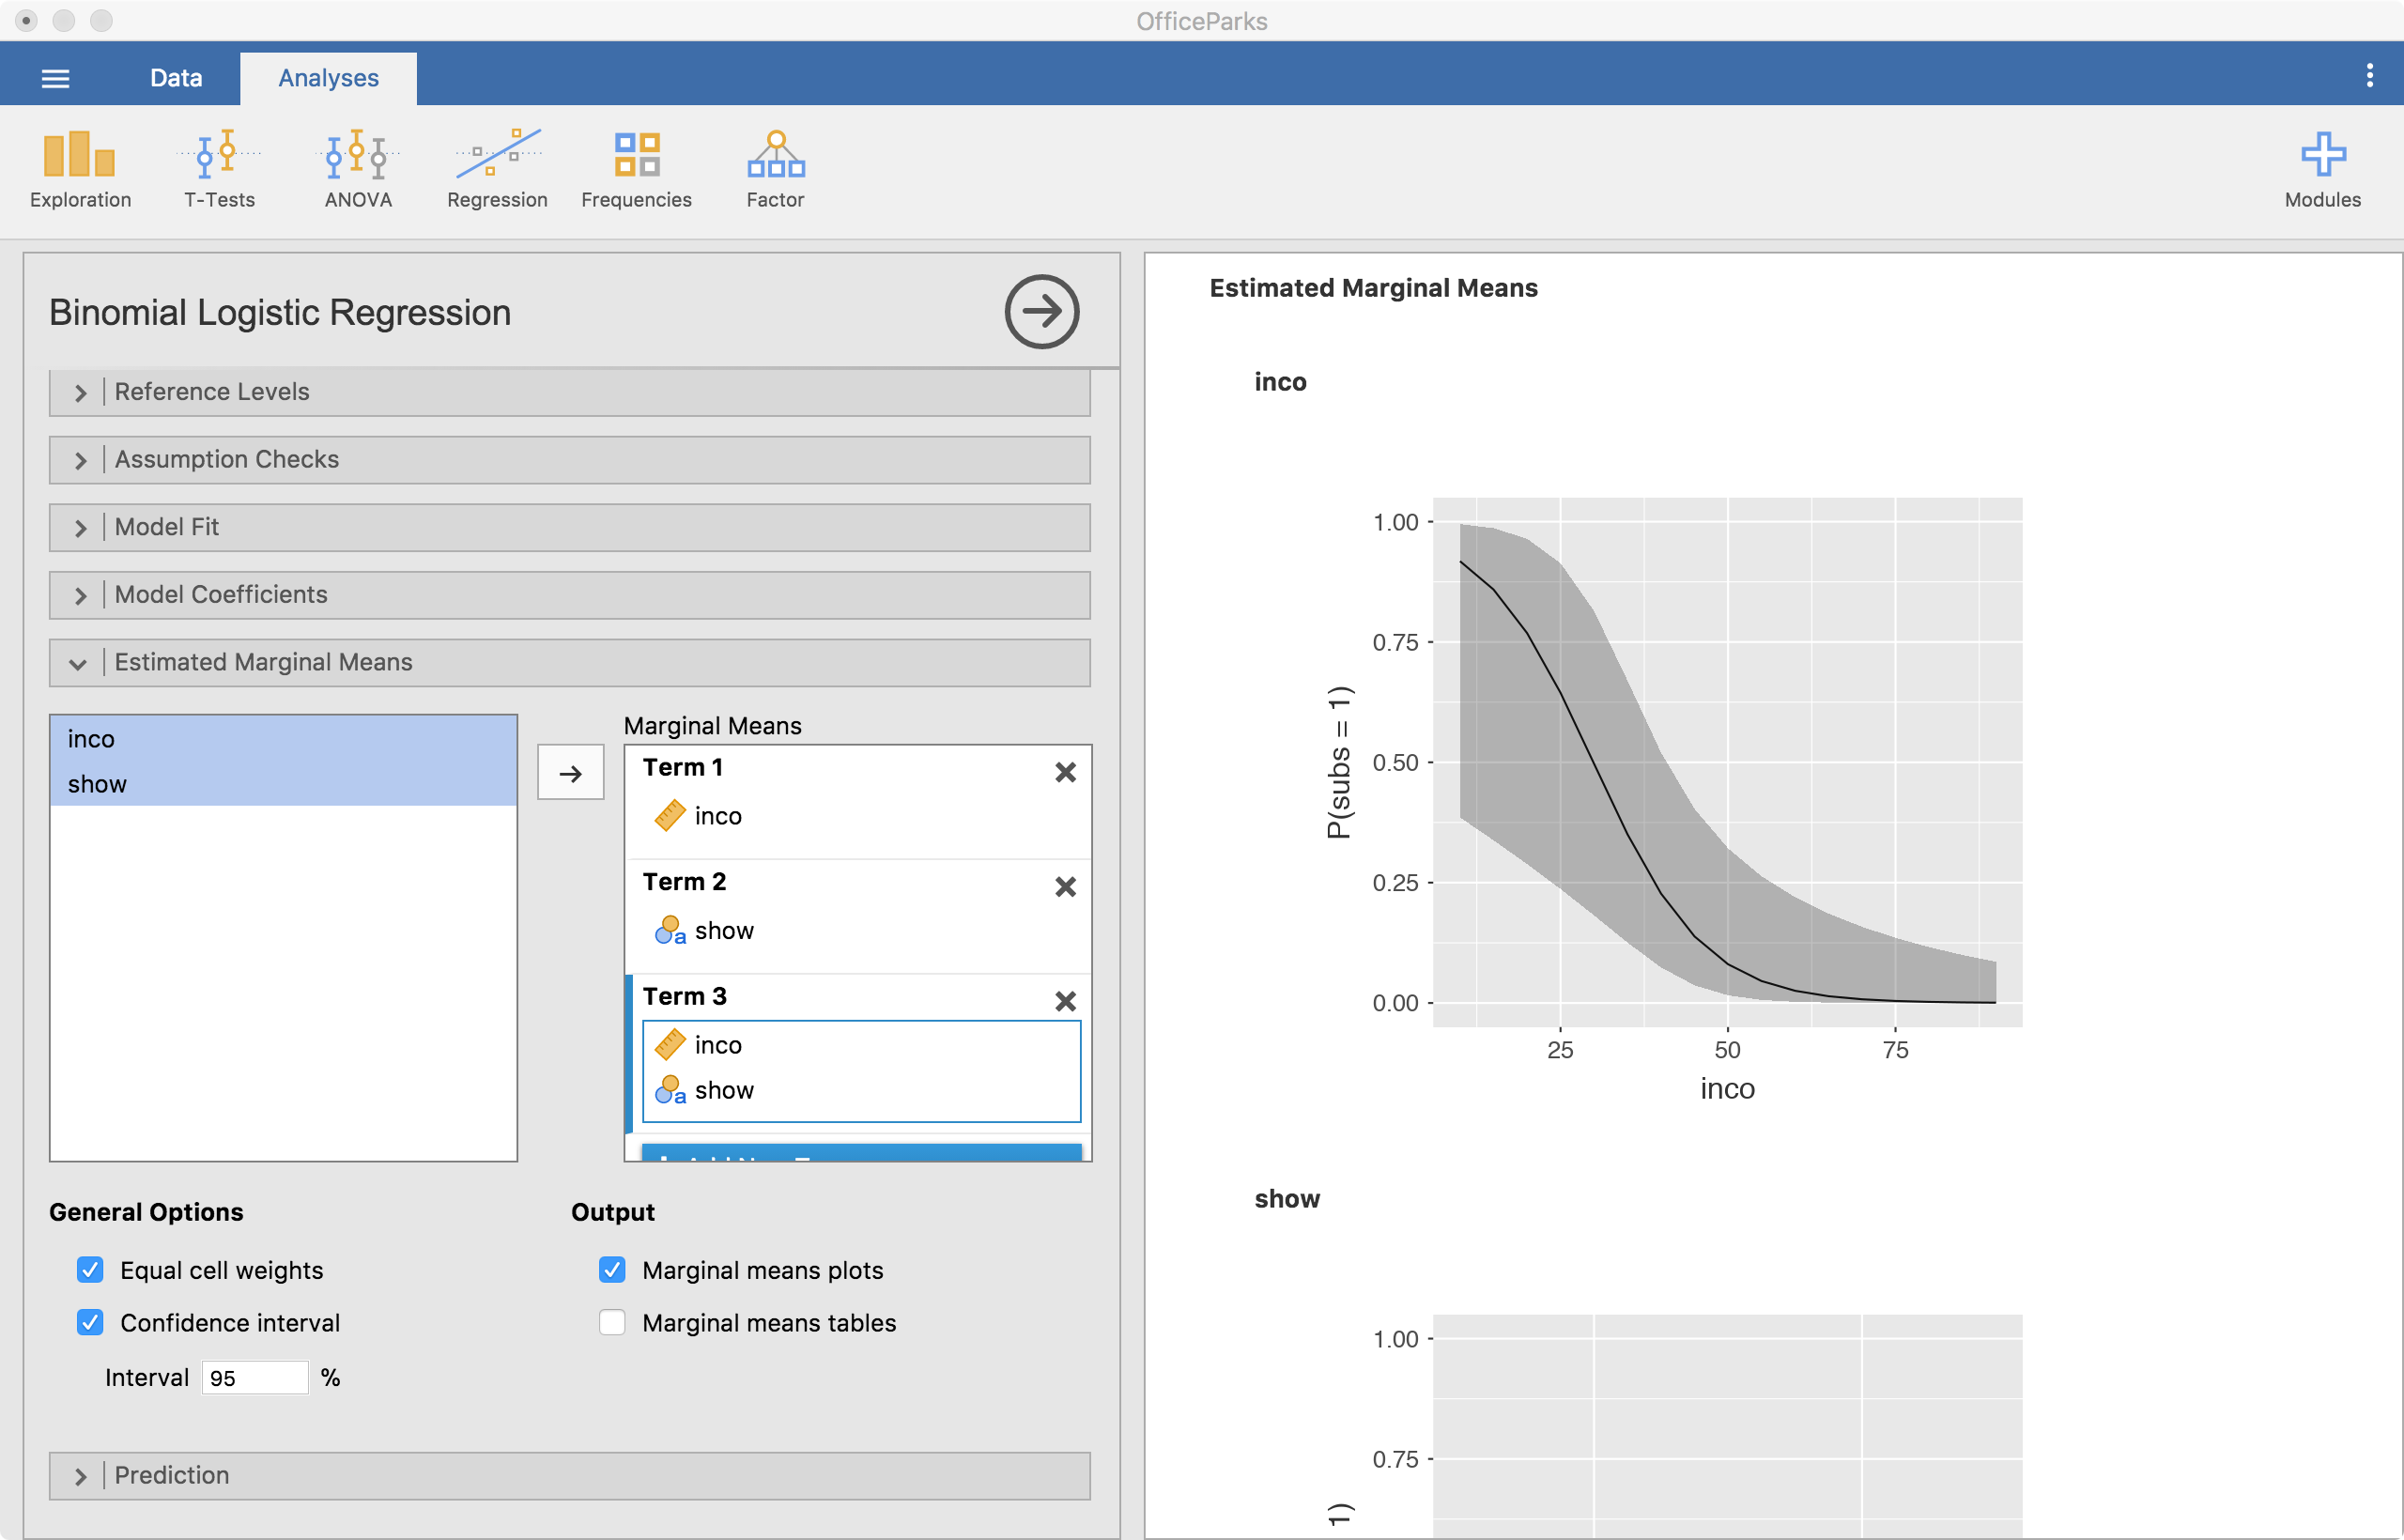
In the screenshot above, Term 1 is the main effect of income because that is the variable I dragged to that slot. Term 2 is show’s main effect. Term 3 is the interaction between pretest and group since they are both in there. It is best if one of the variables is continuous, make that one the first one in there. That is because the second is always considered a grouping variable. So, with continuous variables, it chops it up into three parts and using it as a categorical predictor for the plot.
Prediction
The prediction menu is particular to logistic regression in Jamovi. This shows us how well our model predicts the outcome of interest. High prediction success can tell us that our model is “good” or “useful.” In the screenshot below, we select the classification table and the accuracy options. Other important options exist, but I won’t cover those here.
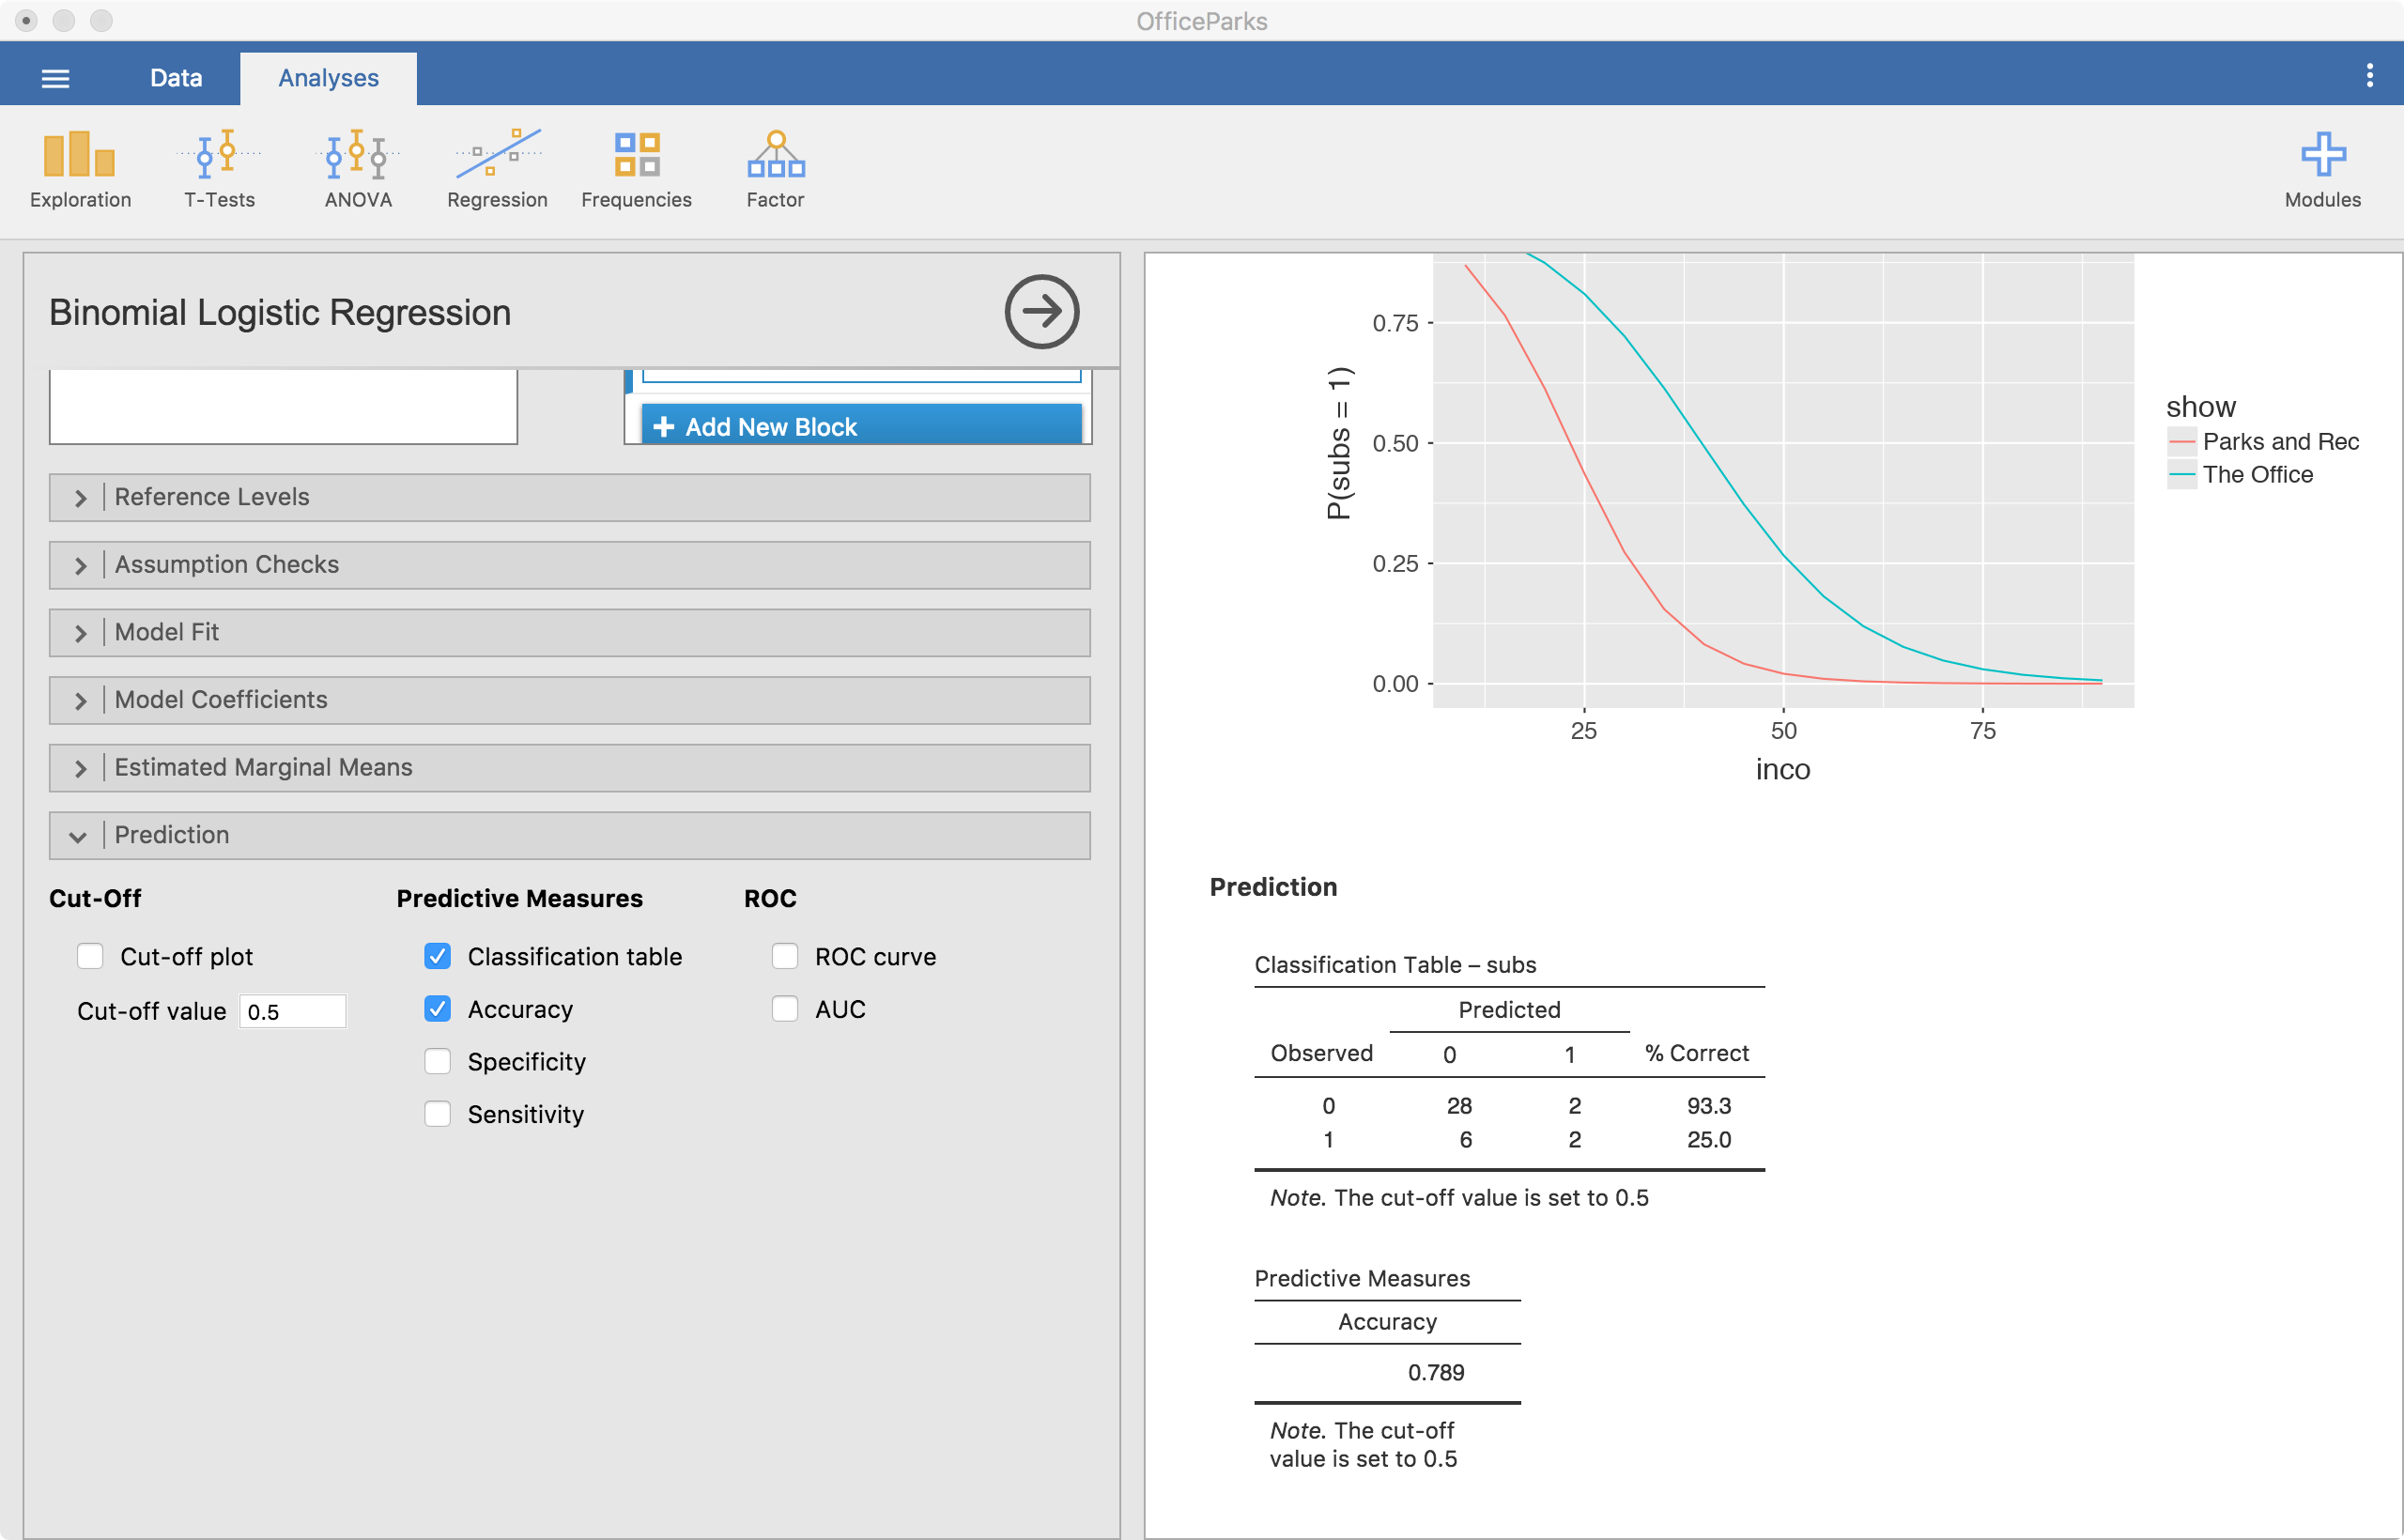
In the screenshot, the classification table is shown. In this example, our prediction accuracy of those that don’t use substances (subs = 0) is high (93.3%) while our prediction accuracy of those that use substances (subs = 1) is low (25.0%). Our overall accuracy rate is 78.9%. Overall, this suggests that our model is not all that great at predicting substance use in this sample.
Conclusions
Well, that’s it for now. Leave comments or questions below!